Author: Accuretti Systems
-

Meralco as a “Natural Hedge”: How JG Summit Buffered a Cyclical Petrochemical Bet
We’ve been blogging for free. If you enjoy our content, consider supporting us!
In conglomerate finance, the most effective hedges are not always derivatives. Often, they are portfolio choices—owning a defensive, cash-generative asset that can steady the ship when a cyclical business turns against you. JG Summit Holdings (JGS) offers a timely example. While its petrochemical unit has endured a punishing global downcycle, JGS’s long-held stake in Manila Electric Co. (Meralco, MER) has acted as a stabilizer through recurring dividends, a large mark-to-market value, and a demonstrated ability to raise cash via block sales when needed.
The contrast is stark. Petrochemicals are exposed to global supply additions, feedstock spreads, and demand swings—variables that can remain unfavorable for years. JGS itself acknowledged that “unfavorable polymer margins” continued to weigh on JG Summit Olefins Corp. (JGSOC) even as the group posted stronger consolidated revenues in 2024. Market reports describing JGSOC’s performance underscore the severity of the trough: 2024 revenue rose on higher volumes, yet margins remained under pressure, translating into sizable EBITDA and net losses and culminating in an indefinite commercial shutdown early 2025 to stem further losses.
Against that backdrop, Meralco sits on the other end of the risk spectrum. As a regulated distribution utility, it is structurally positioned to generate steadier cash flows than commodity-linked petrochemicals. JGS highlights Meralco among its core investments, disclosing an equity stake of 26.4% and placing the market value of that stake at ₱145.0 billion as of December 27, 2024—a clear signal of the holding’s financial weight at the parent level. That “core investment” framing matters: it suggests Meralco is not merely a passive financial bet, but a strategic anchor that contributes to dividends, balance-sheet flexibility, and investor confidence—especially when other units face headwinds.
Built early: the hedge predates the petrochem stress
The Meralco position was not assembled as an after-the-fact rescue line. JGS built it early and deliberately. In 2013, the group made its initial Meralco investment by purchasing San Miguel’s stake—reported at ₱72 billion—marking JGS’s entry into power distribution and diversifying its earnings base. This foundation was later reinforced: by mid-2017, JGS disclosed it acquired an additional 27.5 million Meralco shares at ₱250 per share, raising its stake to 29.56%—a move that increased its exposure to Meralco’s dividend stream and long-term value.
Then came a critical feature of good hedges: optional liquidity. In July 2022, JGS executed a block sale of 36 million Meralco shares at ₱344 per share, raising ₱12.384 billion and reducing its stake from roughly 29.56% to “over 26%.” The transaction demonstrated that the Meralco holding was not only valuable on paper—it could also be mobilized to strengthen the parent balance sheet when market windows open, without fully exiting the investment.
The cash engine: dividends that keep arriving
Dividends are where the hedge becomes tangible. Meralco’s dividend history shows a consistent pattern of cash distributions, including semi-annual payouts in recent years (for example, declared cash dividends in 2024 and 2025). For a holding company, these recurring inflows serve multiple purposes: they can support debt service, fund capex elsewhere, or provide a buffer during periods when a cyclical subsidiary requires support.
In JGS’s case, this dynamic is particularly relevant given management’s disclosures about macro and segment headwinds. JGS’s 2024 CEO report explicitly cited prolonged petrochemical weakness as one of the group’s major crosswinds, even as other units benefited from improving demand. When a cyclical business is under stress, stable dividends from core investments become more than a yield story—they become time and optionality for the parent.
Mark-to-market ballast: the stake is big enough to matter
A hedge is only as good as its scale. Here, Meralco’s contribution is not marginal. JGS itself disclosed a ₱145.0 billion market value for its Meralco stake as of late December 2024, making it one of the parent’s most financially consequential portfolio assets. Moreover, publicly available market quotes around early October 2025 place Meralco shares in the mid-₱500s range, reinforcing that the stake remains a substantial mark-to-market component of JGS’s overall valuation picture.
This matters in a very practical way. If investors are assessing worst-case scenarios for petrochemicals—such as heavy impairments or debt absorption—Meralco’s stake provides an immediately observable asset base that can temper those fears. It does not erase risk, but it changes the conversation from “existential threat” to “balance-sheet management,” especially when the parent reports consolidated equity and maintains access to capital markets.
A portfolio lesson: manage correlation, not just exposure
The broader lesson for Philippine holding companies is about correlation. Cyclical businesses can be profitable over time, but they can also compress cash flows simultaneously—especially in downturns that hit multiple sectors. A portfolio that includes a large, dividend-paying, comparatively defensive investment can soften the blow and preserve strategic flexibility.
JG Summit’s experience illustrates how this can work in practice: a volatile industrial business faces a prolonged trough, while a regulated utility stake continues to provide cash returns and balance-sheet ballast. The Meralco position—built in 2013, expanded in 2017, partially monetized in 2022, and still meaningful today—has effectively served as a natural hedge against the risks inherent in heavy-asset cyclicals.
In the end, the most useful hedge is the one you can hold through the storm. For JGS, Meralco has been that asset—cash-generative, sizable, and credibly monetizable—while petrochemicals navigates an unforgiving global cycle.
We’ve been blogging for free. If you enjoy our content, consider supporting us!
-

Financing Costs Take Center Stage at Villar’s Vista Land
We’ve been blogging for free. If you enjoy our content, consider supporting us!
Vista Land & Lifescapes (VLL) has always been a story of two engines: the cyclical churn of homebuilding and condo turnovers on one side, and the steadier cadence of rental income from commercial assets on the other. In the first nine months of 2025, both engines did their job—barely. Consolidated revenues rose a modest 2.2% to ₱28.399 billion, supported by real estate sales (+~3%) and rental income (+~3%).
But the quarter’s real headline isn’t the topline. It’s the bill that arrives after the sales and rent checks clear: financing cost.
A decent earnings print—until you look at the interest line
VLL reported net income of ₱9.462 billion, up ~4.3% year-on-year (9M 2024: ₱9.076 billion), with EPS rising to ₱0.668 (from ₱0.627).
On paper, that’s a clean, incremental improvement—especially in a market that’s still juggling buyer affordability, selective demand, and uneven project completion cycles.
Yet under the surface, the company’s progress is being increasingly “taxed” by the cost of money. Interest and other financing charges jumped ~17% to ₱5.925 billion (from ₱5.043 billion), with management attributing the increase primarily to lower capitalization of interest during the period—meaning more borrowing costs flowed directly to the income statement rather than being parked in asset costs.
The financial soundness table tells the same story in a single ratio: EBITDA-to-total interest fell to 1.34x (from 1.89x a year earlier). That is not a crisis number, but it is a clear signal that interest burden is rising faster than operating cushion.
Operating discipline helped—but it can’t fully outrun higher carry
To VLL’s credit, the company did what businesses do when the interest meter runs fast: tighten the controllables. Operating expenses fell to ₱7.057 billion from ₱7.742 billion, supported by lower advertising and promotion, professional fees, and repairs and maintenance, per management’s discussion.
Costs of real estate sales also edged down to ₱4.552 billion from ₱4.625 billion.
This discipline is exactly why net income still grew. But it also highlights the key constraint: there is a limit to how far expense efficiency can go when financing costs are moving in the opposite direction. Eventually, the financing line starts dictating what kind of growth is “allowed”—how fast you can launch, how aggressively you can build investment properties, and how quickly you can recycle capital into new inventory.
The balance sheet says “stable,” but leverage keeps the interest sensitivity high
As of September 30, 2025, VLL’s total assets rose to ₱387.581 billion (from ₱377.939 billion at end-2024), while total liabilities stayed broadly flat at ₱242.599 billion (vs ₱241.852 billion). Equity improved to ₱144.982 billion (from ₱136.087 billion), reflecting the period’s earnings.
Liquidity remained adequate but slightly softer: current ratio of 1.74x, down from 1.81x at end-2024.
Meanwhile, VLL disclosed leverage measures such as debt-to-equity at ~1.10x and net debt-to-equity at ~0.84x as of period-end.
The debt stack remains meaningful: notes payable at ₱104.240 billion, bank loans at ₱54.653 billion, and loans payable at ₱11.442 billion, plus lease liabilities.
VLL also described refinancing actions—most notably, loans payable fell ~41% as borrowings were refinanced into bank loans.
This matters because when financing costs are the pressure point, debt mix changes—what’s fixed, what reprices, what can be prepaid—become as important as unit sales and mall occupancy.
The Macro Catalyst: BSP rate cuts and the refinancing window
BSP has already moved—rates are down, and the cycle may be near its end
The Bangko Sentral ng Pilipinas (BSP) has delivered a meaningful easing cycle. In its December 11, 2025 decision, the BSP cut the policy (overnight RRP) rate by 25 bps to 4.50%, with the deposit and lending facility rates correspondingly adjusted. Reports also noted that the BSP has reduced rates by a cumulative ~200 bps since the easing cycle began (August 2024) and signaled that the easing cycle is “nearing its end” and future moves would be data-dependent.
Earlier in 2025, the BSP also cut rates to 5.25% in June (another 25 bps), reinforcing the broader downtrend in domestic benchmark rates.
How does this help VLL? It depends on what portion of debt can actually reprice
A BSP rate cut is not a magic eraser for interest expense—especially for issuers with large chunks of fixed-rate bonds and notes. VLL itself discloses that much of its interest-bearing liabilities carry fixed rates, including notes payable with coupons across a wide band and peso bank loans with fixed rates in a mid-to-high single-digit range.
Still, rate cuts matter in three practical ways:
- Cheaper refinancing of maturing peso obligations
As policy rates fall, banks typically reprice new loans and rollovers lower (though not one-for-one). For a developer with ongoing maturities and refinancing activity, the real benefit arrives when old tranches are replaced with new ones at lower coupons. VLL’s own disclosures show continued funding activity and covenant monitoring, and it even noted a new ₱5 billion, three-year loan facility signed for refinancing purposes after the reporting period—suggesting refinancing remains an active playbook, not a theoretical one. - Improved negotiating leverage with lenders
In a lower-rate environment, issuers with scale and bank relationships can re-open conversations on pricing, tenor, and covenant headroom. VLL highlights compliance with key covenants (current ratio, leverage, DSCR-type measures) across its debt programs, which supports lender confidence and can translate into better refinancing terms. - A slower growth penalty from interest carry
The most immediate “earnings” impact is not always a dramatic reduction in interest expense; it can be a reduction in the incremental cost of funding new launches and capex. This matters for VLL because investment properties and project launches expanded during the period—investment properties rose to ₱145.524 billion and inventories to ₱61.692 billion—both of which typically have funding footprints. Lower benchmark rates can soften the future carrying-cost curve.
The fine print: what BSP cuts won’t fix
Two realities temper the optimism:
- Fixed-rate debt doesn’t reprice unless it is refinanced early, called, or replaced at maturity—sometimes with redemption premiums and transaction costs. VLL’s disclosure includes multiple note and bond programs with specified terms and redemption features, implying refinancing benefits arrive unevenly across maturities.
- USD debt costs are influenced more by global dollar rates and FX than by BSP alone. VLL has significant USD-denominated notes payable exposure and also holds USD investments, which means refinancing economics must consider both rate differentials and currency movements.
Bottom line: VLL’s operating story is intact—its financing story is the swing factor
VLL’s 9M 2025 results read like a company doing the right operational things: steadying revenues through rentals, managing costs, and keeping earnings modestly higher.
But the same report makes it clear where the market should keep its flashlight trained: ₱5.925 billion of financing charges and an interest-coverage indicator that has weakened year-on-year.
If the BSP’s easing cycle has indeed brought policy rates down to 4.50% and created a window for cheaper refinancing, VLL has a clear incentive to use it—especially with refinancing activity already evident and a new ₱5 billion facility signed for that purpose.
In short: VLL can still sell homes and collect rents, but the next chapter may be written by the treasurer as much as by the sales team. In an environment where the BSP has cut rates and signaled the easing cycle may be nearing its end, execution on refinancing—timing, pricing, and maturity management—could be the difference between steady profits and squeezed returns.
We’ve been blogging for free. If you enjoy our content, consider supporting us!
- Cheaper refinancing of maturing peso obligations
-
PNB’s Bond Move Meets a BSP Rate Cut—The New Squeeze — When Rate Cuts Meet Fixed-Rate Bank Bonds
We’ve been blogging for free. If you enjoy our content, consider supporting us!
Philippine National Bank’s return to the peso bond market would normally be filed under “good news”: strong demand, a sizeable PHP 15.7 billion raise, and a clear promise to funnel proceeds into eligible projects under its Sustainable Financing Framework. But markets don’t grade banks on deal headlines—they grade them on spread, the narrow space between what a bank earns on assets and what it pays for money. And that spread is now facing a two-sided pincer: a fresh BSP rate cut that can pull loan yields down, and new fixed-rate bond funding that doesn’t reprice lower.
A bond deal priced for yesterday’s rate environment
PNB’s issuance came in two tranches: Series A (3-year) at 5.4877% and Series B (5-year) at 5.7764%, for a combined PHP 15.7 billion. Those are clean, tradable coupons investors like because they are predictable. For the bank, however, predictability cuts both ways: these rates are locked in, creating a relatively firm “floor” for a portion of PNB’s funding costs over the next three to five years.
That matters because PNB’s earnings machine is still overwhelmingly powered by net interest income. In its latest quarterly filing covering the period ended September 30, 2025, PNB reported net interest income of PHP 39.3 billion and a net interest margin (NIM) of 4.7% for the first nine months of the year. When a bank introduces more wholesale, fixed-rate funding into the mix, it increases the chance that overall funding costs drift upward—unless the proceeds are deployed into assets that earn meaningfully more than that fixed coupon.
Then came the BSP’s easing move—lower policy rates, lower pricing gravity
On December 11, 2025, the Bangko Sentral ng Pilipinas cut the target reverse repurchase (RRP) rate by 25 bps to 4.50%, citing benign inflation and weaker growth, while signaling the easing cycle may be nearing its end. A policy rate cut is not just a macro headline; it’s a pricing signal that seeps into the banking system. Over time, it can soften interest rates across the curve—deposit pricing, wholesale funding benchmarks, and critically, loan pricing.
And that’s where the profitability tension sharpens. In easing cycles, banks often hope for a benign sequence: funding costs fall faster than asset yields, supporting NIM. But when a bank adds fresh fixed-rate bond funding, it risks changing that sequence. Bond coupons don’t follow the BSP downward. Meanwhile, loan yields—especially for new production or repriced credits—can trend lower as the overall cost of money declines and competition intensifies.
The core risk: loan yields may fall, but bond funding stays expensive
Here is the cleanest way to see the risk: the BSP’s rate cut pulls down the “gravity” of borrowing costs. When benchmark rates move lower, banks typically face pressure to reprice or originate loans at lower rates—particularly in competitive segments and for high-quality borrowers. That means asset yields can fall over time.
But PNB’s new bond funding is priced in the mid‑5% range and is fixed. If loan yields soften due to easing—while bond coupons remain unchanged—then the spread between what PNB earns and what it pays can narrow. That is textbook margin compression: assets reprice down, liabilities don’t fully follow, and NIM drifts lower even when volumes are growing.
The risk is not theoretical. PNB’s 17‑Q already shows how meaningful interest expense is to the model: for the first nine months of 2025, total interest expense was PHP 13.07 billion, including PHP 630.3 million for “bonds payable.” Add more bond funding and—unless deployment is swift and high-yielding—interest expense becomes stickier at precisely the moment the BSP is trying to make money cheaper.
Why the first few quarters after issuance matter most
A second layer of risk is timing. Bond proceeds arrive quickly; loan deployment—especially into projects that meet sustainability criteria—can take longer. PNB itself states the net proceeds will be used to finance or refinance eligible projects under its framework. If deployment lags, banks often park funds temporarily in liquid assets. In a falling-rate environment, those liquid assets may earn less, while bond coupons keep running—turning the early months into a “negative carry” window that can pull on NIM.
This is why investors shouldn’t judge the bond deal by oversubscription alone. The real scoreboard is whether the bank can keep its margin stable while adding fixed-rate funding. PNB’s reported 4.7% NIM provides a useful baseline heading into the post-issuance period.
The counterpoint: rate cuts can boost loan demand—volume can cushion the squeeze
To be fair, BSP easing can also be helpful for banks. Lower policy rates are designed to support activity; they can lift credit demand, encourage refinancing, and reduce debt service burdens. If loan volumes accelerate enough, banks can sometimes offset thinner spreads with higher earning-asset balances. PNB’s own 17‑Q shows that loans and receivables rose 6.5% versus year-end 2024, indicating momentum in asset growth even before the December cut.
But volume is not a free pass. When rates fall, banks must avoid the temptation to buy growth at the expense of pricing discipline—especially if they are carrying fixed-rate liabilities that won’t reprice lower. If PNB uses the bond proceeds to fund assets that are either low-yielding or aggressively priced, the “growth story” can still translate into weaker NIM.
What to watch: three tells that reveal whether NIM holds or slips
Because the bond was listed on December 11, 2025, the post-issuance effect will show up more clearly in subsequent periods rather than the September 30, 2025 filing. When PNB reports new numbers, three items will tell the story quickly:
- Loan yield trend — do new bookings and repricings show softening rates consistent with BSP easing?
- Funding cost mix — does the new bond carry make interest expense less responsive to falling rates?
- NIM direction vs 4.7% baseline — does it hold, or does the combination of lower loan yields and fixed bond coupons compress the spread?
Bottom line
PNB’s bond issuance strengthens funding diversification and signals confidence, but the macro backdrop has shifted: the BSP has lowered the policy rate to 4.50%, reinforcing a downtrend in borrowing costs that can pull loan yields lower. With PNB’s new bond financing locked at 5.49%–5.78%, a portion of the bank’s funding costs becomes fixed and comparatively expensive just as the system is easing. If loan rates fall faster than the bank’s blended funding costs, the natural result is net interest margin compression—a risk that will only be confirmed (or disproved) in the coming quarters’ NIM and net interest income prints.
We’ve been blogging for free. If you enjoy our content, consider supporting us!
-

Rate Relief, Real Returns: Who Wins as the BSP Cuts to 4.5%
We’ve been blogging for free. If you enjoy our content, consider supporting us!
The Bangko Sentral ng Pilipinas (BSP) delivered another 25‑bp rate cut today, bringing the policy rate to 4.5%—its fifth trim in this easing cycle and a clear signal that officials are leaning dovish to cushion a year of weaker growth and benign inflation. For listed Philippine companies, that shift unlocks a new pecking order of beneficiaries: property developers and REITs at the top, banks close behind, and telcos and power names improving their free‑cash‑flow math as borrowing costs slide.
Property: The immediate, broad‑based winner
Lower policy rates translate swiftly into cheaper mortgages, lower hurdle rates for new projects, and improved valuation multiples—a trifecta for developers. Industry analysts have already framed BSP easing as a catalyst for residential demand and commercial activity: more affordable homeownership, revived pre‑selling momentum, and better leasing economics as SMEs regain confidence. That backdrop bodes well for Ayala Land (ALI), SM Prime (SMPH), Megaworld (MEG) and Robinsons Land (RLC).
Two marquee names showcase why falling funding costs matter. ALI has been an active issuer in local debt markets—most recently ₱15B sustainability‑linked bonds—and carries a diversified mix of residential, estates, malls, offices, and hotels to absorb recovery across segments. SMPH continues to fund expansion with peso bonds priced around 5.9–6.3% across 2030–2035 tenors, plus a ₱100B 2025 capex plan focused on malls and integrated developments—exactly the kind of growth that is easier to finance as rates step down.
Beyond funding, the product mix is aligning with the cycle. Recent sector notes point to a pivot toward premium projects where demand proved more resilient than in mass housing; easing rates should progressively re‑open affordability at the mid‑market while keeping high‑end buyers engaged. Together, that supports pre‑sales normalizing from post‑pandemic drags and helps developers re‑price risk at lower discount rates.
REITs: Yield vehicles re‑rate when risk‑free falls
REITs are essentially spread businesses: they pay investors a dividend funded by rents, and they finance assets using debt. When the policy rate and the risk‑free curve step down, listed REIT yields become relatively more attractive, and interest expense declines on variable‑rate and refinanced borrowings. Expect improved sentiment for AREIT, RCR, FILRT, MREIT, and DDMP, with the best‑positioned names showing strong WALE, visible rent escalations, and prudent leverage. Property commentaries have already flagged this dynamic—lower rates spur portfolio activity and can lift REIT valuations as discount rates compress.
Banks: NIMs may edge down, but volume and trading gains step up
For banks, the rate story is nuanced. Net interest margins (NIMs) can compress modestly as asset yields drift lower, yet Philippine pass‑through is sticky—funding costs (especially CASA deposits) often reprice slower than policy rates, cushioning near‑term margin pressure. Meanwhile, easing supports loan growth and can unlock trading/OCI gains on securities as yield curves shift. Fitch’s sector work earlier signaled that delayed, gradual cuts would let banks preserve elevated NIMs longer, with volume tailwinds from consumer credit; local transmission analysis similarly highlights slow funding-cost adjustments given abundant low‑cost deposits.
- BPI (BPI): 1H25 net interest income +16%, loans +14% YoY, and NIM expansion to ~4.58% underscore a bank leaning into higher‑yielding retail while keeping capital buffers strong—an attractive setup when rates fall, and volumes rise.
- BDO (BDO): Management flagged NIMs as flattish to slightly lower in an easing cycle, but BDO’s CASA ~70%+ and diversified book typically absorb the shift; lower rates also help fee businesses and securities.
- Metrobank (MBT): Loan growth +10.8%, trading & FX gains +18% in 9M25, plus a presentation showing falling funding costs offsetting yield pressure—hallmarks of a bank that benefits from gradual easing via volumes and market gains.
- China Bank (CBC, formerly CHIB): NIM ~4.58%, net loans +14% YoY, and a sizeable securities book (~₱571B) suggest potential OCI tailwinds and lower funding costs as cuts filter through.
The macro overlay helps: the BSP’s Dec 11 cut to 4.5% and earlier guidance of data‑dependent easing imply a measured path, which historically is friendlier to bank profitability than sharp, rapid cycles.
Telcos: Lower interest expense strengthens the free‑cash‑flow story
High‑capex, high‑debt telcos are natural beneficiaries of lower borrowing costs. PLDT (TEL) trimmed 2025 capex to ₱68–73B and is targeting positive FCF by 2026—rate cuts reduce interest expense, ease refinancing risk, and reinforce that trajectory. Globe (GLO) is on track for positive FCF by 2025 with capex down and EBITDA targets intact; lower policy rates nudge debt service lower, improving coverage ratios and dividend visibility.
For investors, the key is simple: telco service revenues move gradually, but finance costs move with the cycle. As BSP easing progresses, the equity narrative shifts from “capex heavy” to “cash‑flow generative,” an inflection markets typically reward.
Power & Utilities: Capital intensity meets cheaper capital
Aboitiz Power (AP) illustrates the capital‑intensive end of the market. With ₱78B–₱101B in group capex earmarked for generation and grid investments—and with recent results noting higher financing costs as a profit headwind—BSP cuts directly lower the weighted average cost of capital and ease debt service as projects ramp. For names with long project gestations, even incremental rate relief supports ROE and project IRR math.
Bottom line: The beneficiaries, ranked
- Property Developers & REITs – most immediate re‑rating via mortgage affordability, lower discount rates, and cheaper funding; watch ALI, SMPH, MEG, RLC, plus AREIT, RCR, FILRT, MREIT, DDMP.
- Banks – modest NIM headwinds offset by sticky funding costs, strong volume, and securities gains; BPI, BDO, MBT, CBC are well placed.
- Telcos – interest expense down, FCF up as capex rolls off; PLDT, Globe stand to benefit.
- Power – cost of capital declines aid project economics; Aboitiz Power is a clear case.
Risks to the view: If easing stalls or reverses due to FX or inflation surprises, banks could see slimmer volume tailwinds, property pre‑sales could hesitate, and REIT re‑rating would pause. But with the BSP signaling a data‑dependent, gradual approach and today’s cut reaffirming a pro‑growth stance, the balance of evidence favors rate‑sensitive winners leading the market into 2026.
We’ve been blogging for free. If you enjoy our content, consider supporting us!
-

Cebu Air’s Underlying Momentum Is Real — and It Shows
Start with the basics. For the nine months to September 30, 2025, CEB logged ₱87.6 billion in revenue, up 18% year‑on‑year. Passenger sales rose 17% to ₱59.7 billion on broad‑based demand recovery; cargo accelerated 30% to ₱5.2 billion; and ancillary revenues—those high‑margin add‑ons like baggage, seat selection, and bundles—climbed 17% to ₱22.8 billion. The top‑line story isn’t just about reopening—it’s about retention and monetization.
More telling than growth is quality. Operating costs did rise (+16% to ₱79.8 billion), as you’d expect with more flights and a bigger fleet. But the key heavy lines behaved: flying operations were essentially flat (+1%), thanks to lower fuel prices offsetting higher consumption and crew counts; depreciation (+21%) and aircraft/traffic servicing (+41%) reflect capacity normalization rather than inefficiency; and short‑term lease costs fell sharply (−80%), signposting better asset planning. Net result: operating income of ₱7.8 billion, up 37%.
The best lens for “underlying momentum” is CEB’s pre‑tax core net income, which filters out outsized, non‑recurring items. On that basis, CEB delivered ₱2.9 billion, double last year’s ₱1.45 billion. Pair that with an EBITDA of ₱22.2 billion and a 25.3% EBITDA margin (up from 23.6%), and you see a business extracting more cash profit per peso of revenue even as it rebuilds capacity. Efficiency metrics corroborate the trend: Cost per ASK ticked down to ₱3.05 from ₱3.10, with the seat load factor steady at 84.8%—proof that routes and pricing are holding.
Of course, the reported net income of ₱9.47 billion (+181%) needs context. Two items gave the year a big glow: ₱5.99 billion booked as other income for five free‑of‑charge Pratt & Whitney GTF engines—a fair‑value recognition tied to industry‑wide AOG mitigation—and ₱226 million from remeasurement on the step‑acquisition of 1Aviation (ground handling), which moved from joint venture to subsidiary. These don’t recur, and the market should normalize them. But they also matter: the engines improve near‑term fleet availability, while consolidating 1Aviation strengthens service control and integration. (Source: CEB Form 17‑Q, 9M 2025)
If there’s a headwind, it’s below the line. Financing costs rose 17% to ₱5.6 billion as deliveries and lease liabilities scaled, and foreign‑exchange losses hit ₱1.25 billion on peso depreciation versus USD and JPY—the currency mix in aviation is stubborn. Yet even here, the interest coverage ratio improved to 1.57x (from 1.32x), reflecting stronger earnings capacity to carry debt and leases.
Balance‑sheet optics have turned decisively better. Equity grew to ₱16.1 billion (from ₱10.0 billion), and book value per common share jumped to ₱21.00 (from ₱7.18), driven by profits despite an active buyback and a ₱2.82 billion dividend to preferred shareholders. On liquidity, the current ratio is a low 0.53x, and current liabilities still exceed current assets by ~₱30 billion—that’s the nature of airline working capital. But cash generation is the counterweight: ₱15.41 billion net cash from operations year‑to‑date, ₱4.78 billion net inflows on investing (proceeds and PDP/security‑deposit refunds, net of capex), and deliberate ₱24.46 billion outflows in financing (debt/lease repayments, treasury purchases, dividends). The company is using cash to de‑risk.
Operationally, the platform is deeper and more resilient. CEB now flies 98 aircraft with an average age of ~6.1 years, across 82 domestic and 42 international routes with roughly 2,700 weekly flights. The AirSWIFT acquisition broadens leisure connectivity (El Nido and other tourist nodes), while 1Aviation consolidation tightens ground operations across thirty‑plus airports. Those moves aren’t mere trophies; they reinforce the commercial engine—better schedule reliability, more ancillary throughput, and improved customer experience that sustains yield.
There are risks worth watching. Fuel and FX remain volatile, and hedging is prudently modest; heavy maintenance accruals (₱5.68 billion HMV YTD) and return condition provisions (₱0.83 billion) underline a busy engineering calendar as utilization rises; lease liabilities are substantial (₱116.84 billion), keeping discipline front‑and‑center. Still, the levers are visible: route profitability, ancillary monetization, tighter ground operations, normalized lease mix, and efficiency at scale.
Bottom line: If you’re trying to decide whether CEB’s 2025 bounce is cosmetic or structural, the core tells the story. Pre‑tax core earnings doubled, margins expanded, CASK declined, and cash flows are funding de‑risking, not just growth. The headline numbers benefited from exceptional items, yes—but the business beneath them is sturdier than it was a year ago. For investors, valuation should key off normalized earnings and EV/EBITDA, but the direction of travel is favorable: an airline that’s earning more per flight and per customer, with a wider network, better integration, and improving balance‑sheet optics.
In a sector where momentum can be fleeting, Cebu Air’s looks real—and increasingly repeatable.
We’ve been blogging for free. If you enjoy our content, consider supporting us!
-

SPC’s outsized 2025 dividend: signal, not trap—yet
SPC Power Corporation surprised the market with a year‑end ₱0.80/share cash dividend—lifting full‑year distributions to ₱1.20/share—after its Board approval on December 9, 2025 (record Dec 26, payable on/before Jan 9, 2026). That move caps a year of margin recovery and leaves investors wondering whether it is sustainable or a one‑off flourish.
At ₱9.00, the combined ₱1.20/share payout implies a ~13.3% full‑year yield—eye‑catching for a net‑cash utility. On trailing measures, independent trackers had SPC’s yield in the 4.4–5.0% range before the latest announcement, reflecting the earlier ₱0.40 mid‑year dividend; the step‑up reframes the yield conversation decisively.
Crucially, 2025’s earnings quality improved. SPC’s 9M‑2025 total comprehensive income rose to ₱1.744B, and EPS reached ₱1.17, even as reported revenues dipped (–10.3%) due to lower pass‑through fuel costs. The gross margin surged to ₱1.494B (from ₱228.5M in 9M‑2024) on cost optimization and better plant utilization; management notes the generation segment contributed ~72% of net income this year, tilting results back toward core operations rather than associates.
On coverage, the numbers are reassuring—but nuanced. Operating cash flow (OCF) for 9M‑2025 stood at ₱1.279B, while cash & cash equivalents were a hefty ₱6.181B—with a current ratio of 11.47 and debt ratio ~0.06, underscoring a net‑cash profile. That means the ₱0.80 year‑end dividend (~₱1.197B) is cash‑covered with room to spare; total FY dividends (~₱1.796B) are covered ~3.4× by cash on hand, though only ~0.71× by 9M OCF—so Q4 cash generation matters for purists who want dividends funded from operations alone.
Associates still play a material role. SPC’s equity share in the earnings of KSPC/MECO was ₱491.0M in 9M‑2025 (down year‑on‑year), yet cash dividends received from associates reached about ₱852.4M over the same period—significant support for parent‑level liquidity. The strategic overlay: Korean media report KEPCO plans to divest its 60% stake in KSPC (SPC owns 40%), potentially reshaping governance and dividend policy at the associate level. That is not inherently negative, but it warrants monitoring because associate cash flows have historically augmented SPC’s payout capacity.
Market conditions are a swing factor, too. The Independent Electricity Market Operator (IEMOP) has expressed optimism for stable/lower WESM prices in 2025 amid ample supply—good for consumers, more challenging for merchant margins if generators cannot offset via efficiency or contracted sales. SPC’s 2025 margin expansion shows it can win on costs; sustaining this in a soft price environment will demand continued operational discipline.
One structural lever is battery energy storage. On October 17, 2025, a wholly owned subsidiary signed supply and EPC contracts for BESS projects in Panay (100 MWh) and Bohol (60 MWh)—positioning SPC to capture ancillary and flexibility revenues as rules mature. The policy groundwork for BESS in the WESM has been laid over recent years; execution will dictate how quickly these assets translate into earnings that can buttress future dividends.
So is SPC’s dividend sustainable—or a value trap? On the evidence, not a value trap. SPC in 2025 showed improved core margins, sits on net cash with minimal leverage, and holds ample liquidity to fund distributions, even at the enhanced year‑end rate. The magnitude of the ₱1.20/share payout, however, is above a normal run rate and depends on Q4 earnings and, to a degree, associate cash flows. In other words, ongoing dividends look supportable; repeating 2025’s size every year would require continued operational strength and no adverse surprises from KSPC or WESM pricing.
For investors, the watch‑list is straightforward: (1) FY‑2025/Q4 results to confirm post‑payout cash and operating cover; (2) KSPC ownership changes and any shift in dividend policy; (3) WESM price trajectory and SPC’s contracted versus merchant mix; and (4) BESS milestones and monetization in the ancillary/Reserve Market. If these line up, baseline dividends (₱0.40–₱0.60) look comfortably repeatable, with top‑ups plausible in stronger years.
We’ve been blogging for free. If you enjoy our content, consider supporting us!
-
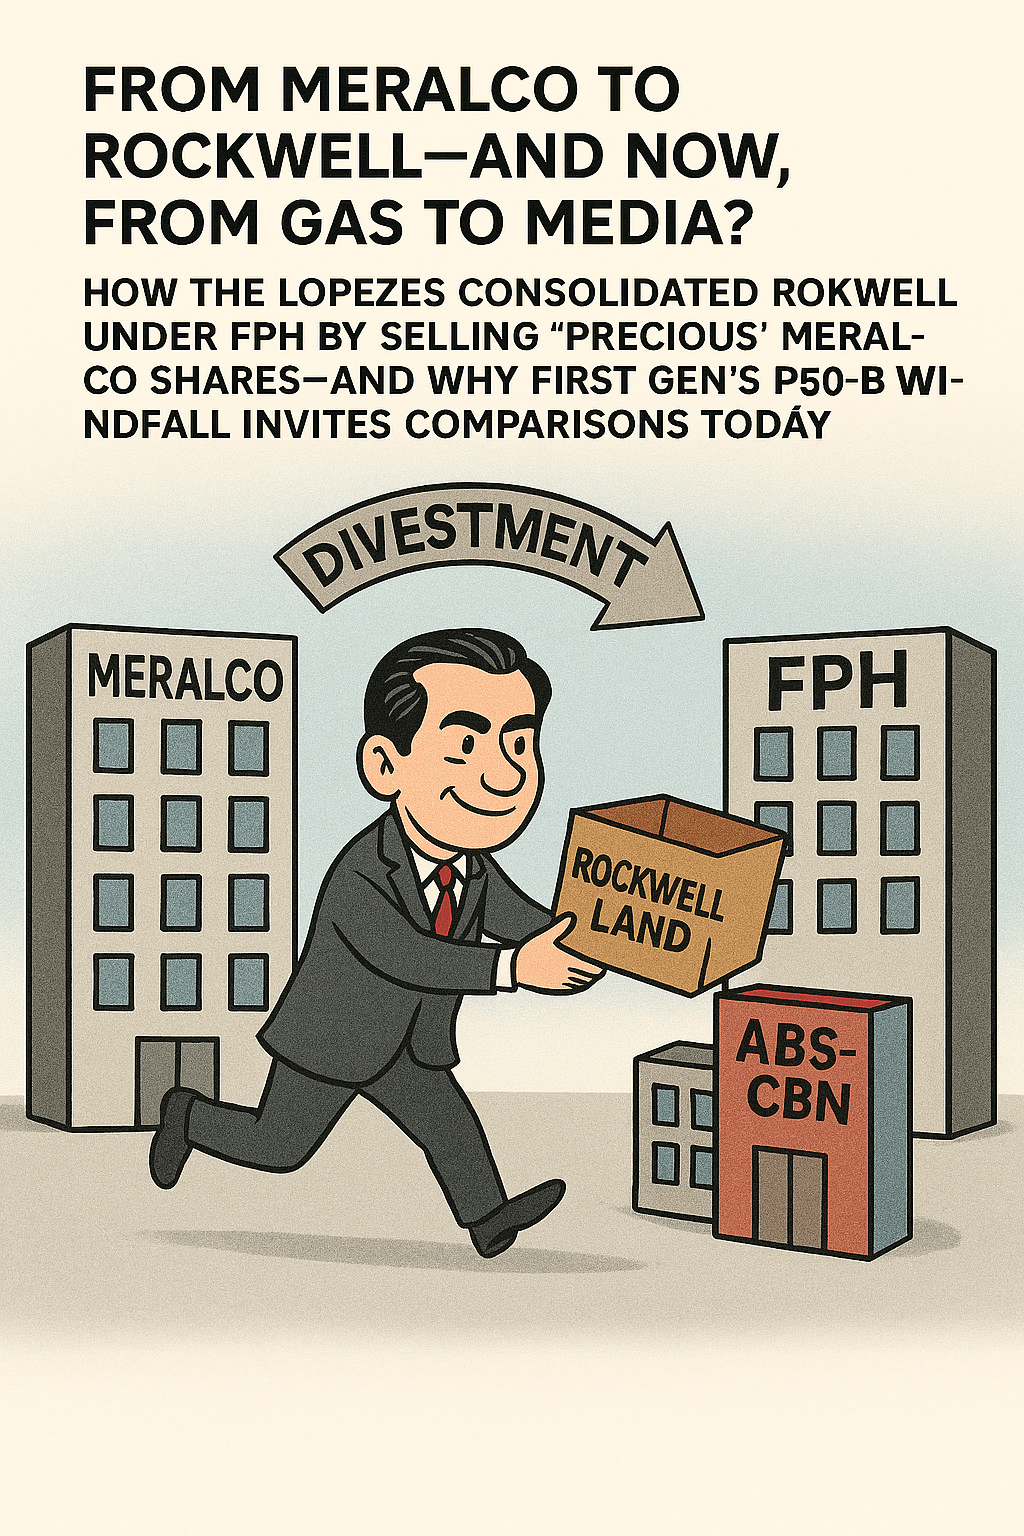
From Meralco to Rockwell: How the Lopezes Restructured to Put Rockwell Land Under FPH’s Control
The Big Picture
In the span of just a few years, the Lopez family executed a complex corporate restructuring that shifted Rockwell Land Corporation firmly under First Philippine Holdings Corporation (FPH)—even as they parted with “precious” equity in Manila Electric Company (Meralco) to make it happen. The strategy wove together property dividends, special block sales, and the monetization of legacy assets, ultimately consolidating one of the Philippines’ most admired property brands inside the Lopezes’ flagship holding company.
Laying the Groundwork (1996–2009)
Rockwell began as First Philippine Realty and Development Corporation and was rebranded Rockwell Land in 1995. A pivotal capital infusion in September 1996 brought in three major shareholders—Meralco, FPH, and Benpres (now Lopez Holdings)—setting up a tripartite structure that would endure for more than a decade.
By August 2009, the Lopezes made a decisive move: Benpres sold its 24.5% Rockwell stake to FPH, lifting FPH’s holdings in Rockwell to 49%, with Meralco owning the balance 51%. That sale—valued at ₱1.5 billion—was part of Benpres’ debt reduction plan and FPH’s push to consolidate control in real estate.
Selling “Precious” Meralco to Fuel the Strategy (2009–2010)
To strengthen the group’s balance sheet and fund growth elsewhere, FPH monetized a significant portion of its stake in Meralco:
- 2009: FPH sold 223 million Meralco shares to the PLDT/First Pacific-led camp for ₱20.07 billion.
- March 30, 2010: Beacon Electric Asset Holdings (the MPIC–PLDT Communications & Energy Ventures consortium) exercised a call option to buy 74.7 million Meralco shares from FPH at ₱300/share (total ₱22.4 billion).
Lopez patriarch Oscar M. Lopez later framed the Meralco divestments as part of a broader strategy that included the group’s massive ₱58 billion acquisition of PNOC–EDC via First Gen—an acquisition that temporarily constrained dividend flows and made balance-sheet flexibility crucial, especially amid the global financial crisis.
The Property Dividend That Changed Everything (2012)
The real plot twist came in 2012, when Meralco declared a property dividend to its shareholders by distributing its 51% stake in Rockwell. Because this instantly created tens of thousands of Rockwell stockholders, Rockwell listed by way of introduction on the Philippine Stock Exchange on May 11, 2012, without a traditional IPO. Immediately after the listing, FPH stood at roughly 52% ownership.
This property dividend served a dual purpose: it unlocked Rockwell for trading while scattering what had been Meralco’s 51% across Meralco’s own investors (including the MVP/Beacon group and San Miguel Corporation), thereby creating acquisition targets that FPH could later consolidate.
Connecting Meralco Proceeds to Rockwell Control (June–July 2012)
With Rockwell now public, Beacon transferred ~1.3 billion Rockwell shares to FPH as additional consideration for the 2010 Meralco sale (the 74.7 million shares at ₱300/share). Those Rockwell shares were crossed at ₱2.01/share (≈₱2.613 billion) via special block sale; Beacon also transferred 84.546 million shares tied to earlier rights and sold 52.787 million more shares to FPH, while the FPH Pension Fund purchased 87.953 million shares—each tranche priced at ₱2.01/share. Together, these actions lifted FPH’s stake to ~76% by late June.
This step is the hinge of the Lopez restructuring: cash flows and agreements from the Meralco disposals directly yielded Rockwell shares, cementing the link between selling a legacy utility stake and consolidating control of a premium property developer.
The Final Piece: Buying SMC’s Rockwell Shares (July 2012)
In July 2012, FPH bought 681.646 million Rockwell shares from San Miguel Corporation at ₱2.01/share—a ₱1.37 billion block sale. This pushed FPH’s ownership to about 87%, effectively cementing control over Rockwell. Public disclosures specified the price and volume but not a specific financing instrument; given the ₱42 billion+ liquidity generated from the 2009–2010 Meralco sales, analysts generally view the SMC block as funded from internal resources (including prior divestments) rather than new external equity.
Where Things Landed (2013–2025)
Subsequent public ownership reports and market databases consistently show FPH holding ~86.6% of Rockwell, a level that has remained relatively stable and that underscores how thoroughly the Lopezes completed their consolidation.
Why It Matters
The Lopezes’ restructuring offers a textbook example of portfolio re‑allocation and control engineering:
- Strategic monetization: Selling down Meralco at attractive prices (including a landmark ₱300/share in 2010) to fund long‑term priorities and de‑risk the group.
- Asset consolidation: Using property dividends and block sales to build a controlling position in a core asset (Rockwell) that aligns with FPH’s real estate platform and brand ambitions.
- Balance‑sheet management: Sequencing transactions amid the PNOC–EDC acquisition and a turbulent macro backdrop to maintain flexibility, liquidity, and control.
It’s a case study in how to transform ownership architecture without a traditional IPO or a costly tender offer—leveraging corporate actions, counterparties’ strategic choices, and timely divestments to arrive at a durable control outcome.
We’ve been blogging for free. If you enjoy our content, consider supporting us!
-

JG Summit Is Priced Like Trouble—But Its Results Tell a Different Story
In a market fixated on macro gloom, it’s easy to miss when a diversified heavyweight quietly stitches together a better earnings base. That is exactly where JG Summit Holdings (JGS) finds itself today: trading near ₱21 despite reporting improving operating metrics and sturdier balance‑sheet ratios. At this price, investors are paying roughly ₱0.41 for every peso of book value—a P/B near ~0.4× against a book value per share of ₱50.91—and ~7× trailing earnings on TTM EPS ~₱2.94. Those are deep‑value multiples more typical of companies with deteriorating prospects, not of a conglomerate whose core engines—airline, property, food, and associates—are starting to pull in the same direction.
Peeling back the layers of JGS’s SEC 17‑Q (9M 2025) helps explain the mismatch. Operating income (EBIT) rose 14.7% to ₱42.0 B, EBITDA climbed 13.8% to ₱69.0 B, and the group’s operating margin improved to 15% from 13% the previous year—signals that pricing, volume, and cost discipline are landing where they should: on cash‑flow coverage of interest and capex. More telling for equity holders, core net income doubled to ₱4.6 B in 3Q25, bringing 9M core to ₱19.3 B; strip out last year’s mega one‑off and recurring core earnings are up 24% YoY. In a weak tape, recurring profitability matters because it turns “cheap” into “too cheap,” especially for holding firms that are perpetually valued with discounts.
The airline story gets most of the headlines—and rightly so. Cebu Pacific (CEB) posted ₱87.6 B revenues (+17.5%) and ₱9.5 B net income for the first nine months, riding stronger passenger demand, higher cargo and ancillary revenues, and the mitigating effect of five free‑of‑charge engines that added ₱6.0 B to other income amid industry‑wide engine supply issues. Crucially, CEB’s transition to larger, more fuel‑efficient NEO aircraft is not just an environmental or fleet optics play; it is a throughput‑and‑unit‑cost story that can carry margin momentum through seasonal lulls, a dynamic the 17‑Q makes plain. For a group trading at ~7× earnings, a visible airline turnaround is precisely the kind of pillar that justifies a P/E re‑rate once macro stops fighting you.
Equally important—but less flashy—is real estate and hotels. Robinsons Land (RLC) delivered ₱34.6 B revenues, with malls up 11%, offices up 5% (occupancy 88%), and hotels up 10%—the sort of recurring NOI breadth investors prize during growth scares. The real kicker is RLC Residences: realized revenues +76% and EBIT +207%, a reflection of the residential cycle turning in earnest. People forget this segment’s duality: recurring income stabilizes, while residential recognitions drive incremental operating leverage. Together, they answer the perennial holding‑company critique—“too much lumpiness”—with cash‑flow geometry that supports debt service and the day‑to‑day grind of funding capex.
Meanwhile, URC—the food arm—did what it often does in difficult input cycles: grew the top line (₱124.6 B, +4.8%) while taking the punch in gross margin (−71 bps) from higher coffee costs and one‑offs tied to packaging rationalization. That may sound unremarkable, but it is the kind of “steady hand” contribution that keeps consolidated earnings defensible while other engines rev. Snacks and ready‑to‑drink beverages led domestic volume, with Malaysia and Indonesia resilient. When you’re assessing P/E and P/B against a holding‑company backdrop, it matters that one core unit can shoulder some input inflation without knocking the group off course.
Then there is MERALCO, the associate that provides ballast when one leg wobbles. Equity earnings of ₱9.5 B in 9M more than offset the petrochemical segment’s ₱8.1 B loss, with MERALCO’s carrying value near ₱87.9 B anchoring the asset base. In other words, while JGSOC remains in indefinite shutdown, producing obvious P&L pain, MERALCO keeps the keel straight. Investors should ask whether the market fully reflects that stabilizer in current multiples; recent pricing suggests not.
Critics will rightly point to financing costs and FX losses: absorbing JGSOC debt lifted net financing costs to ₱14.5 B (+11.6% YoY), and the group booked ₱680 M in FX losses as the peso softened against USD and JPY. Those headwinds are real, and they dilute the otherwise clean operating story. Yet they are also rate/FX‑cycle artifacts, not structural flaws—especially with interest coverage at 4.34×, gearing at 0.58, and net debt‑to‑equity at 0.48. Liquidity appears adequate (current ratio of 1.23), and the capital program is being funded as leverage ratios improve. This is exactly the balance‑sheet posture you want before the market decides to pay more than ₱0.41 per peso of equity.
If the market tape were friendlier, perhaps the re‑rating would have arrived already. But the PSEi has labored under growth concerns and a weaker peso, clocking multi‑year lows into November and early December. That backdrop keeps discounts wide even for names with improving micro. In this sense, JGS’s valuation looks less like a verdict on operating quality and more like collateral damage from index‑level risk‑off. Still, markets don’t stay pinned forever, and holding firms with clearer cash‑flow paths typically lead the early stages of any sentiment thaw.
What unlocks the gap? Three near‑term catalysts stand out. First, a credible JGSOC roadmap—such as restart economics, asset monetization, or timeline certainty—removes the single biggest overhang and lowers the debt drag on the parent. Second, CEB needs to keep printing: unit‑cost discipline, hedged fuel coverage, and continued NEO ingress can sustain quarterly profits through seasonality and convince skeptics that 2025 wasn’t a one‑off. Third, RLC should keep doing the unglamorous work: occupancy in malls/offices, steady tenant sales, and smooth recognition of pre‑sold inventory. None of these requires heroics; they require execution—something the 17‑Q suggests is already happening. With those pieces in place, moving from ~₱21 toward the street’s ₱30–₱31 center line looks reasonable, even if broader sentiment remains mixed.
The bottom line is simple: JGS is priced like trouble, but the results show progress. In 9M 2025, the conglomerate improved margins, scaled core, and de‑risked leverage while diversified engines worked in tandem to offset the petrochemical drag. When investors pay ~0.4× book and ~7× earnings for that profile, they’re not buying perfection—they’re buying optionality: the chance that execution plus one or two catalysts force the market to close the gap. In our book, that’s the kind of fundamentally cheap worth a hard look.
We’ve been blogging for free. If you enjoy our content, consider supporting us!
-

Rent Is the Engine, Refinancing Is the Weather: Reading SM Prime’s 9M 2025
In a year when higher funding costs and mixed consumer signals have turned developers cautious, SM Prime Holdings (SMPH) just delivered a set of numbers that feel both familiar and instructive: steady rent‑led growth, softness in residential, and a heavier–but manageable—refinancing calendar.
On the headline figures, consolidated revenues rose 4% to ₱103.40B for the first nine months of 2025, carried by rent (up 7% to ₱60.99B), while real estate sales eased 2% to ₱31.20B. Costs and expenses fell 1%, pushing operating income up 9% to ₱51.90B and net income (attributable) up 10% to ₱37.24B. EPS clocked in at ₱1.291, with a cash dividend of ₱0.480 already paid in May.
The Core Story: Malls Still Do the Heavy Lifting
SMPH’s malls continue to anchor earnings strength. In the nine months, Malls posted ₱60.92B in revenue and ₱31.51B in pre‑tax profit; Residential contributed ₱32.58B and ₱10.41B, respectively; Hotels & Conventions added ₱6.01B and ₱1.01B; Commercial & Integrated Developments generated ₱3.89B and ₱3.01B. Operating leverage is visible: the company squeezed more profit out of largely flat third‑quarter revenues thanks to disciplined costs.
This operating resilience rests on footprint and execution. SMPH opened SM City Laoag in May and SM City La Union in October, bringing the Philippine mall count to 89 (plus 8 in China). The pipeline of redevelopments also supports rent and occupancy, while hotels, offices, and conventions continue to offer steady—if smaller—contributions.
Where the Fuel Mix Shows Some Octane Lag
The Residential engine sputtered a bit: real estate sales slipped 2% year‑on‑year and segment profit ticked lower. Receivables and contract assets rose (₱107.25B), with unbilled revenue tied to construction milestones also higher—fine if build schedules and collections remain tight, more delicate if they don’t. Meanwhile, non‑cash OCI headwinds—FVOCI losses in the equity book and a weaker cash‑flow hedge reserve—trimmed total comprehensive income to ₱35.67B (from ₱37.21B), even as net income advanced.
These are not structural breaks; they are friction points that investors should watch: project take‑up and construction cadence, pricing power, and the sensitivity of SMPH’s OCI to market marks.
Balance Sheet: Bigger Tank, Higher Octane Price
On the funding side, interest‑bearing debt climbed to ₱419.82B (+8% YTD), while current maturities rose to ₱112.08B. SMPH notes these are “due for refinancing,” a normal course for a developer of this scale. Coverage remains sound: interest coverage at 7.06×, debt/EBITDA at 4.84×, and net debt‑to‑equity at 46:54. Liquidity is adequate, with a current ratio of 2.28× and acid‑test 1.29× (excluding items flagged for refinancing).
Hedging helps: after swaps, roughly 57% of long‑term borrowings are effectively fixed‑rate. Still, derivative assets came down with maturities and fair‑value changes—less cushion than last year, but consistent with a company rolling hedges as the book evolves.
The Bottomline
SMPH’s playbook still works: rent growth and operating discipline carry the income statement; capex and landbanking expand the footprint; hedges and market access keep the funding bridge sturdy. The residential wobble and OCI marks are the ballast on comprehensive profits, not the anchor. The refinancing calendar is heavier, but coverage and liquidity suggest it’s navigable—especially for a name that just placed ₱25B in retail bonds and continues to roll projects and tenants into an already dominant network.
As with any property stock in a higher‑for‑longer world, the cost of money is the weather: if it worsens abruptly, sentiment and valuation can swing faster than the EPS math. But in the base case, SMPH’s rent engine remains powerful enough to keep the vehicle moving—just perhaps with a touch more fuel discipline and a keener eye on the road ahead.
We’ve been blogging for free. If you enjoy our content, consider supporting us!